Airbnb Investment Analysis: How to Evaluate a Property Before You Buy
Not every high-revenue Airbnb is a good investment. Learn how to evaluate occupancy, NOI, cap rate, cash-on-cash return, and deal risk before you buy.
nmin readReleased on:July 7, 2026Last updated on:September 27, 2026

Overview:
- An Airbnb analysis estimates annual revenue, subtracts the full operating cost, and measures what remains against the cash invested. Confirm first that zoning, licensing, and HOA rules permit nightly rentals at the address.
- Revenue and expenses are where projections break. Revenue should come from twelve months of comparable performance rather than peak season, against market occupancy of 55% to 65%. Expenses should be built line by line, since the owner pays management, cleaning, utilities, and reserves.
- Stress-test before committing capital. Calculate the break-even occupancy and the minimum nightly rate that keeps cash flow positive, because a property that only works at aggressive assumptions has no margin for a slow year.
Airbnb investment analysis is the process of estimating a property’s revenue, subtracting its full operating costs, and measuring the return against the cash required to buy and finance the STR property. The core question is simple: does the property still pencil under realistic occupancy, expense, and loan assumptions?
The key metrics are gross revenue, net operating income, cap rate, cash-on-cash return, and DSCR. Together, they show how much income the property can generate, how much cash flow remains after expenses and debt service, and whether the deal supports both the investor’s return target and the rental loan structure.
An Airbnb property should produce acceptable returns under average operating conditions, not only during peak season. One of the most common mistakes first-time investors make is overestimating occupancy or nightly rates, which artificially inflates revenue and cash flow.
This guide walks investors through the key metrics used to analyze Airbnb rental properties, explains how to interpret the results, how to use AirDNA, and helps determine whether a deal pencils before committing capital.
What Does Airbnb Investment Analysis Actually Measure?
An investor's total return on real estate investment comes from two sources: the income a property generates today and how much its value increases over time. A simplified way to think about that relationship is:
r = Cap Rate + g
Here, r represents the expected annual return, the cap rate measures the property's current income yield, and g is the annual appreciation rate. A property with a 7% cap rate in a market appreciating 3% per year produces an expected total return of about 10% before financing. Likewise, a lower cap rate can still support attractive returns if long-term appreciation is strong.
This approach provides a useful snapshot, but it assumes every year is the same and ignores when cash is actually received. In reality, rental income arrives over time, and the sale proceeds are realized years later.
Because money received in the future is worth less than money received today, professional investors often use discounted cash flow (DCF) analysis and internal rate of return (IRR) to evaluate return on investment (ROI) over the entire holding period.
IRR is the annualized return generated from purchase through sale, incorporating both the amount and timing of every cash flow. While it is one of the most comprehensive investment metrics, it also depends heavily on assumptions about future appreciation and the eventual sale price.
For most individual Airbnb investors, current cash flow metrics provide a more practical basis for evaluating a property than long-term return projections built on uncertain exit assumptions.
Occupancy, nightly rates, operating expenses, and financing costs can be measured today, while future resale values remain uncertain. For that reason, this guide emphasizes cash flow metrics rather than a discounted cash flow model when evaluating the investment potential of an Airbnb property.
Airbnb Investment Analysis: The Core Metrics
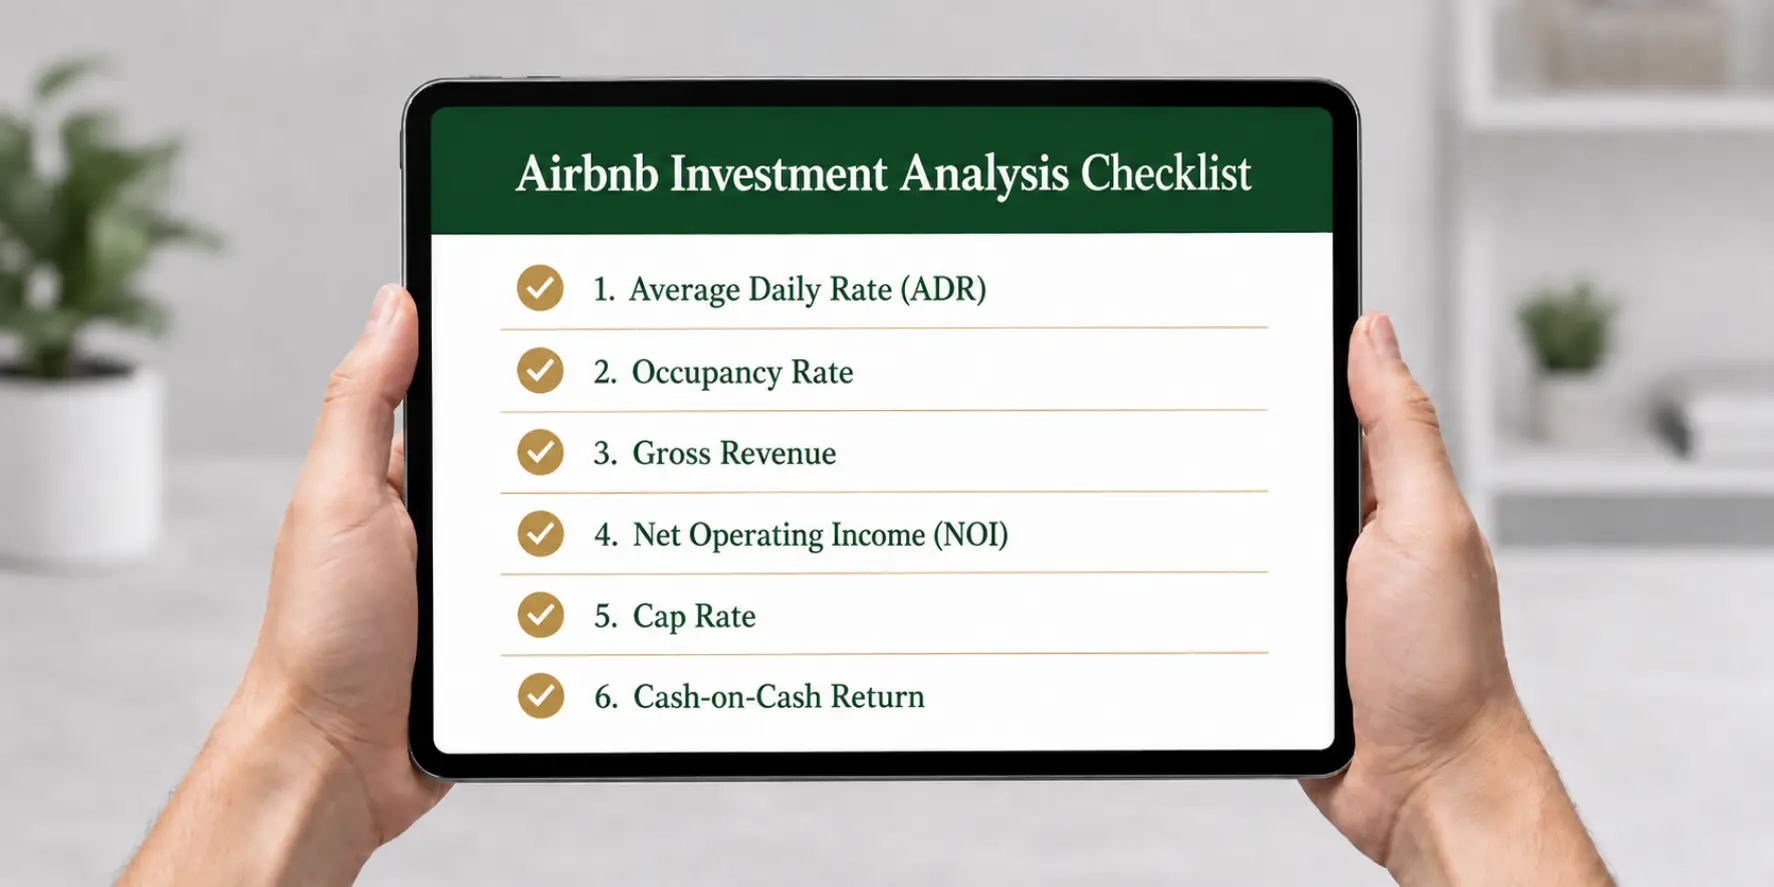
Successful Airbnb investments come down to a handful of numbers. Some measure revenue potential, others measure profitability, and the rest help investors compare one opportunity with another. Understanding how these metrics work together is the foundation of evaluating whether an Airbnb investment deal pencils.
Average Daily Rate (ADR)
Average Daily Rate (ADR) is the average nightly rate a property earns over a full year after seasonal fluctuations, discounts, and pricing adjustments. ADR is one half of the revenue equation, but it should never be evaluated on its own. A high nightly rate has little value if the property struggles to maintain consistent occupancy.
Occupancy Rate
Occupancy rate measures the percentage of available nights booked during the year. Healthy Airbnb markets typically average between 55% and 65% occupancy. A property that only produces acceptable returns at 80% occupancy in a market averaging 56% relies on optimistic assumptions rather than realistic operating performance.
Gross Revenue and RevPAR
Gross revenue represents the total rental income generated before operating expenses.
Gross annual revenue = ADR × occupancy rate × 365
RevPAR (Revenue per Available Rental) combines ADR and occupancy into a single metric by measuring revenue generated for every available night. It allows investors to compare listings more accurately by balancing pricing power against booking performance.
Net Operating Income (NOI)
Net Operating Income (NOI) equals gross revenue minus operating expenses, excluding mortgage payments. Because financing is removed from the calculation, NOI measures the property's operating performance rather than an individual investor's financing strategy.
The same property produces the same NOI regardless of whether it is purchased with cash or debt.
What Is a Good Cap Rate for an Airbnb?
Cap rate, short for capitalization rate, measures a property's income yield before financing by dividing NOI by the purchase price.
Cap rate = NOI ÷ purchase price
Because financing is excluded, cap rate provides a consistent way to compare properties across markets. In many Airbnb markets, cap rates between 6% and 10% are considered attractive.
Lower cap rates generally indicate investors are paying for future appreciation, while unusually high cap rates often reflect higher operating or market risk.
Cash-on-Cash Return and ROI
Cash-on-cash return measures the annual return on the investor's actual cash invested after financing is considered.
Cash-on-cash return = annual pre-tax cash flow ÷ total cash invested
Unlike cap rate, cash-on-cash return reflects the impact of financing because mortgage payments reduce the cash flow an investor actually receives. It answers one specific question: what annual return is the investor earning on the cash invested in the property today?
Because it incorporates leverage, cash-on-cash return makes it easy to compare vacation rental properties requiring a similar cash investment or evaluate whether the capital could earn a better return elsewhere.
Like cap rate, however, it is a point-in-time metric. It measures a single year's pre-tax cash flow and does not account for future appreciation, loan amortization, or tax benefits.
A high cash-on-cash return does not necessarily translate into a high total investment return, which is why it should be evaluated alongside other metrics rather than used in isolation.
Airbnb Investment Analysis: How Does AirDNA Work?
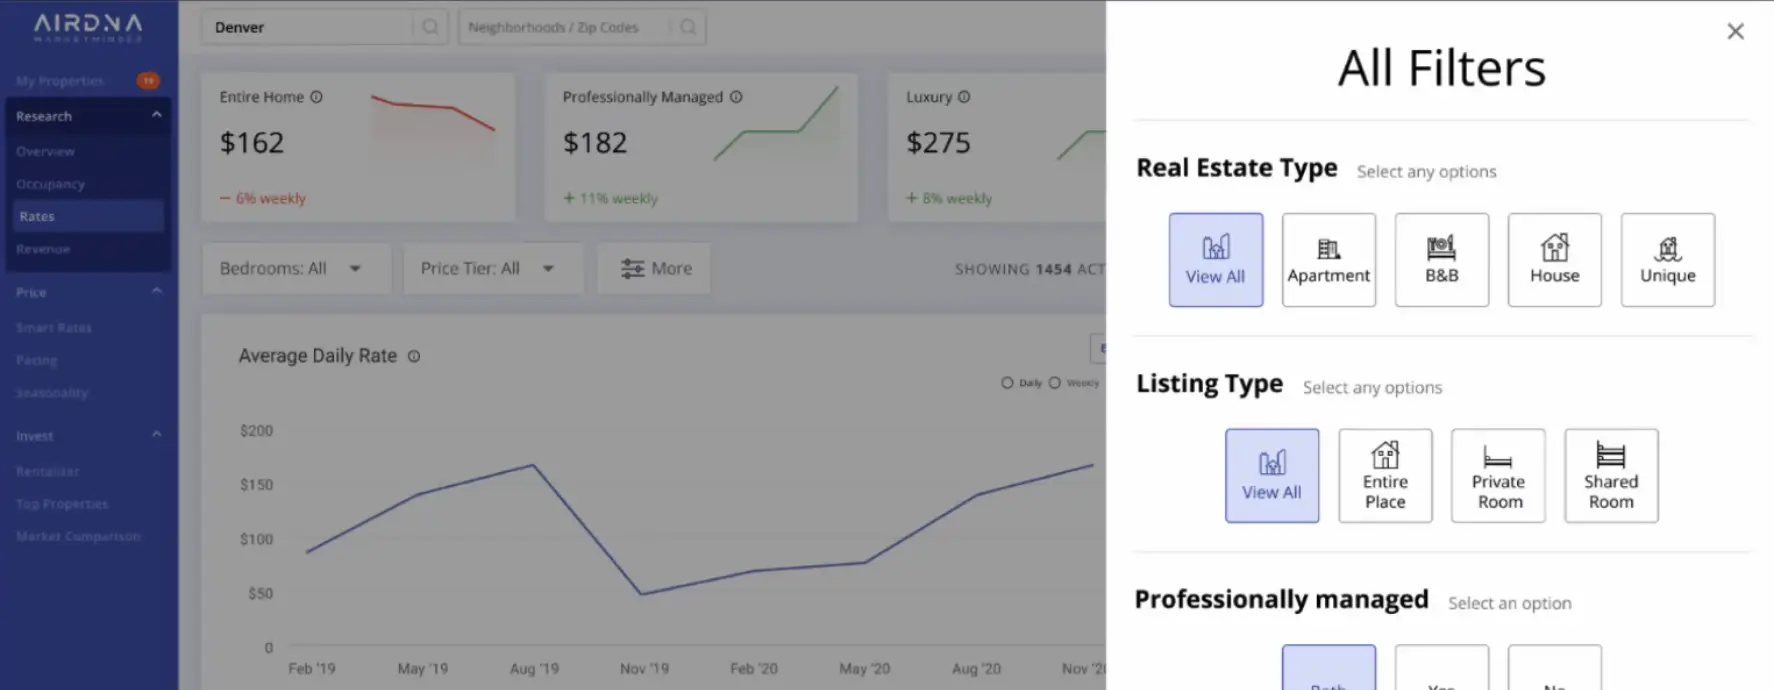
Every metric in the previous section depends on two revenue inputs: average daily rate and occupancy rate. If a property already operates as a short-term rental, those numbers come from its booking history. Most acquisition targets do not have that history.
They may be vacant, owner-occupied, or rented to long-term tenants. AirDNA helps fill that gap by using booking activity from comparable Airbnb and Vrbo listings to estimate market demand.
Investors typically use that data in two ways. First, they evaluate the market. AirDNA's MarketMinder dashboard shows average daily rate, occupancy, revenue per available night, supply growth, and local regulation at the city or submarket level. Second, they estimate a specific property's revenue.
The Rentalizer tool compares the target property with similar listings based on location, bedroom count, bathroom count, and guest capacity, then estimates projected nightly rate, occupancy, and annual revenue.
Lenders offering short term rental loans take a different approach. Ridge Street Capital underwrites Airbnb properties using AirDNA data to evaluate market-supported rental income and determine whether the property can support the loan. That difference can materially affect the loan amount available to the investor.
AirDNA projections are useful, but they should not be accepted without adjustment. The estimate is based on comparable listings, not the property's own operating history. In deep markets with many similar rentals, the projection is usually more reliable.
In thinner markets with fewer comparable listings, one unusually strong property can distort the result. A conservative investor discounts the first-year revenue estimate, compares it against another data source, and confirms the assumptions with a local property manager.
AirDNA helps answer the revenue side of the analysis. The next step is understanding what the property costs to operate.
The Operating Expenses Investors Underestimate
After revenue assumptions, the next major mistake is underestimating operating expenses. Many investors apply a long-term rental expense model to a property that will be listed nightly, even though STR carry higher owner-paid costs, more frequent turnover, and greater wear.
The largest recurring expenses usually fall into several categories:
- Property management: Professional short-term rental management often costs 20% to 30% of gross revenue, making it one of the largest operating expenses for investors who do not self-manage.
- Cleaning: Cleaning costs typically range from $75 to $200 per turnover. A property with frequent guest turnover can absorb thousands of dollars per year in cleaning costs alone.
- Utilities: Airbnb owners usually pay for electricity, water, gas, trash, and high-speed Wi-Fi. Monthly utility costs commonly range from $200 to $600 or more, depending on property size, climate, guest usage, and local rates.
- Property taxes: Property taxes vary by location and are typically based on the assessed value of the property. They are fixed annual costs that apply regardless of occupancy, so they should be included even if the property has slow booking periods or temporary vacancy.
- Insurance: Short-term rentals usually require specialized insurance coverage, which is often more expensive than a standard landlord policy and may vary significantly by market.
- Supplies and maintenance: Unlike a long-term rental, the owner usually pays for consumables, guest amenities, repairs, landscaping, and ongoing maintenance. High guest turnover also creates more wear and tear than a single long-term tenant.
- Platform and software fees: Booking platforms such as Airbnb and Vrbo charge fees on each reservation, while software tools for pricing, guest communication, smart locks, channel management, and bookkeeping add recurring subscription costs. Both should be included when estimating operating expenses.
- Furnishing reserve: Furniture, appliances, and small household items wear out over time. Setting aside a reserve helps prevent replacements from becoming unexpected cash flow problems.
- Capital replacement reserve: A portion of revenue should be set aside for major repairs and replacements, including the roof, HVAC system, plumbing, and electrical systems. This reserve helps prevent large capital expenses from becoming sudden cash flow problems.
Acquisition Costs Are Not Operating Expenses, But They Still Matter
Operating expenses determine whether the property can produce cash flow after it is placed in service. Acquisition costs determine how much cash the investor needs to close the deal. These costs are not recurring monthly expenses, but they should still be underwritten carefully because they affect the total capital invested and the property’s cash-on-cash return.
Investors should account for lender origination fees, title costs, appraisal fees, legal fees, recording fees, prepaid taxes, prepaid insurance, and any required reserves. A deal that looks strong on monthly cash flow can produce a weaker return if the upfront cost basis is understated.
How to Run an Airbnb Investment Analysis, Step by Step
Once the key metrics are defined and the property location is selected, the analysis should follow a clear order. Each step builds on the one before it. Skipping a step can make the final return numbers look stronger than they really are.
Step 1: Confirm Short-Term Rentals Are Legal at the Address
Before running revenue projections, confirm that the property can legally operate as a STR. Check local zoning rules, licensing requirements, permit caps, primary-residence restrictions, and HOA rules.
A property can show strong projected revenue and still be a poor investment if the city, county, or association does not allow nightly rentals.
Step 2: Estimate Revenue From Full-Year Comps
Use at least twelve months of performance data from comparable listings on AirDNA that match the target property by location, bedroom count, bathroom count, and guest capacity. Revenue should be based on full-year performance rather than peak-season pricing.
A property that earns strong nightly rates during summer or holiday periods may perform very differently during slower months.
Step 3: Build the Expense Model
Apply a realistic expense ratio to the revenue estimate, then break the budget into individual line items. Include property management, cleaning, platform and software fees, insurance, utilities, supplies, maintenance, furnishing reserves, capital replacement reserves, property taxes, and any local permit or licensing fees.
A single expense percentage can be useful as a screening tool, but the final analysis should show the actual cost structure of the property.
Step 4: Calculate NOI, Cap Rate, and Cash-on-Cash Return
Run the profitability metrics in order. Start with gross revenue, then subtract operating expenses to calculate net operating income. Divide NOI by the purchase price to calculate cap rate. Then subtract annual debt service from NOI and divide the remaining pre-tax cash flow by total cash invested to calculate cash-on-cash return.
Step 5: Confirm Financing Terms and Total Loan Costs
Before relying on the projected return, confirm how the deal will actually be financed. Get pre-approved, review the available loan amount, and account for the full cost of financing, not just the interest rate.
Origination fees, lender fees, appraisal costs, title charges, closing costs, prepaid taxes, insurance, and required reserves all affect the total cash invested and the final cash-on-cash return.
The best Airbnb lenders will review the property-level assumptions, evaluate projected income, and help investors understand whether the deal can support the requested loan amount. A strong lender should give a realistic picture of the financing structure before the investor commits capital.
Step 6: Stress-Test the Deal
Stress-test the investment before relying on the projected return. Calculate the break-even occupancy rate, the minimum ADR needed to keep cash flow positive, and the point where NOI no longer covers debt service.
If the property only works at aggressive occupancy or nightly rate assumptions, the deal may not have enough margin to survive a slower year.
Case Study: Running the Numbers on a Real Naples Park Property
Every metric so far has been explained in the abstract. Here is one real Florida deal, taken through the same analysis, with the actual figures a lender's underwriting file produced.
_result.webp)
The Property and the Market Backdrop
The property is a 1972-built, three-bedroom, two-bath home in the Naples Park neighborhood of Naples, Florida, on a standard single-family lot. It carries features that support short-term rental appeal: a screened lanai, a private backyard with patio and mango trees, and an attached garage.
It last sold in 2012 for $230,000 and traded again in 2026 for $620,000, a gain that works out to roughly 7.5% annual appreciation over the hold, a strong run even by Naples Park standards. The property was also originally listed for $699,900 before selling at $620,000, an 11.4% reduction from the initial asking price. That gap is worth sitting with. A buyer who anchored to the list price would have analyzed a materially worse deal than the one that actually closed.
Running the Airbnb Investment Analysis
The property's DSCR loan financed $496,000 of the $620,000 purchase price at 6.917% over 30 years, producing a monthly principal and interest payment of $3,272.30, or $39,267.60 a year. Total cash to close, including the down payment, lender costs, title fees, insurance, escrow, and prepaid interest, came to $144,513.52.
Assuming the owner self-manages and the property is purchased rent-ready, operating costs run about 20% of gross revenue to cover cleaning, platform fees, and routine maintenance, on top of insurance and property taxes.
Against $39,267.60 in annual debt service, the property clears $5,500.40 in net profit for the year, about $458 a month. On the $144,513.52 total cash invested, that is a 3.8% cash-on-cash return, a modest but real number.
What Actually Justifies This Deal
A 7.22% cap rate and a 3.8% cash-on-cash return are respectable, not spectacular. What makes the deal work is the second half of the return equation covered earlier in this guide:
r = Cap Rate + g.
At this property's 7.22% cap rate and this market's historical 7.5% appreciation rate, total unlevered return runs close to 14.7%, a genuinely strong figure. Leverage pushes the equity-level return higher still, since the mortgage rate sits below the property's unlevered yield.
That is the real case for a deal like this one. The cash flow covers its own debt service with room to spare, and the appreciation this market has shown does the rest of the work toward a strong total return.
When Lower Cash Flow Can Still Make Sense
Not every strong rental investment produces high cash flow on day one. As described in the beginning of this article, real estate returns come from two sources: cash flow and appreciation.
A property with modest cash flow today may still make sense if it sits in a market with strong appreciation potential, while an income-focused investor may prefer a property with higher current yield and slower value growth.
In a slower market, the entry basis becomes even more important. An off-market property purchased at a discount in a strong rental market can still generate attractive returns if the investor buys below market value and underwrites the exit conservatively.
The key is knowing which return driver supports the deal. Lower cash flow can be acceptable when the investor is buying into a strong location or improving the property through renovation.
Tax benefits may also improve after-tax returns, especially when the owner qualifies for the short-term rental tax loophole and depreciation strategies are available, but investors should confirm those assumptions with a CPA before relying on them.
A lower-cash-flow deal should still be underwritten carefully. Appreciation, value-add potential, and tax benefits can support an investment thesis, but they should not be used to justify unrealistic revenue assumptions or an operating model that cannot survive a slower year.
From Airbnb Investment Analysis To Financing
Once the numbers clear an investor's threshold, financing becomes the next step, and here the analysis feeds directly into the loan. Conventional mortgages underwrite long-term market rent, which usually falls short of what an Airbnb property actually earns, so investors turn to DSCR rental loans for Airbnb that qualify the property on its own projected cash flow.
Ridge Street Capital finances short-term rentals across 35 states using the same Airbnb financing logic the analysis produces, so the projected NOI you build during due diligence becomes the figure the loan is written against.
Frequently Asked Questions
How much money do you need to start an Airbnb investment?
Plan for a down payment of 20% to 25% of the purchase price, plus furnishing costs that typically run $15,000 to $30,000 for a mid-size home and a cash reserve for the slow season. On a $360,000 property, that means roughly $90,000 to $130,000 in total cash before the first guest checks in.
Can you finance an Airbnb using the property's projected income?
Yes. A DSCR loan qualifies the borrower on the property's debt service coverage ratio rather than personal income, which suits investors whose tax returns understate their true earnings.
Is Airbnb still a good investment in 2026?
Airbnb can still be a good investment in 2026, but the margin for error is smaller than it was during the previous growth cycle. Short-term rentals can outperform long-term rentals when the market supports consistent nightly demand, but investors should not underwrite the deal using peak-season rates or best-case occupancy.
A strong deal should produce positive cash flow under realistic assumptions, including average market occupancy, full operating expenses, and current financing costs. As a general benchmark, an Airbnb property with a cap rate above 6% and positive cash flow at normal occupancy levels may still be worth serious consideration. For market selection, see our guide to the best places to buy an Airbnb.
How does an Airbnb compare to a long-term rental on the same property?
An Airbnb can produce higher NOI and a stronger cap rate than a long-term rental when the market supports consistent nightly demand. For example, a $360,000 property rented long-term at $2,300 per month would generate $27,600 in annual rent and might produce about $19,300 in NOI, or a 5.4% cap rate.
The long-term rental figure still matters because it shows the downside case. If regulations change or STR demand weakens, the investor knows what the property may earn as a fallback. To check numbers, use our rental property profit calculator.
Zach Cohen is the Managing Partner of Ridge Street Capital, a direct private lender providing hard money and DSCR loans to real estate investors across 36 states. Under his leadership, the firm has funded nearly $100 million in investment property loans. He regularly works with real estate investors on rental property acquisitions, refinances, and fix-and-flip projects across the country.
Fix and Flip Loans
Funding For Purchase + Rehab
- $50,000 up to $3,000,000
- Interest Rate 10.5%-11.5%
- Origination Fee From 1.5%
- Up to 90% of Purchase and 100% of Rehab

DSCR Loans For Long Term Rentals
Perfect for first-time investors or experienced investors scaling their rental portfolio.
- Up to $2,000,000
- Interest Rates from 6.0%
- Origination Fee From 0%
- Up to 80% of LTV

DSCR Loans For Short Term Rentals
Designed for investors pursuing higher rents with a short term rental strategy.
- Up to $2,000,000
- Interest Rates from 6.25%
- Origination Fee From 0%
- Up to 80% LTV
Ready to Get Started?
.svg)