Best States to Buy Rental Property in 2026


June 18, 2026
The state with the strongest population growth is not always the state where a rental property pencils out. Gross rents and job growth help investors identify where demand is moving. They do not reveal how much cash flow remains after insurance, taxes, vacancy, and other operating expenses are accounted for. As a result, a market that looks attractive on paper can produce weaker debt coverage than expected. That gap between market-level indicators and property-level underwriting is where many state-selection mistakes are made.
We created this guide to help real estate investors evaluate rental property markets through the lens of cash flow, risk, and long-term performance. It explains which metrics matter most, how real estate cycles influence investment decisions, how to distinguish strong rental markets from weak ones, and why several high-profile states carry more risk than their reputation suggests.
Top 5 States to Buy Rental Property in 2026
To rank these states, Ridge Street evaluated eight core factors: affordability relative to rent, rent growth, home appreciation, vacancy, property taxes, insurance costs, landlord-friendliness, and current market cycle position. The analysis incorporates data from Zillow home value and rent indexes, U.S. Census Bureau population and vacancy surveys, Bureau of Labor Statistics employment data, Federal Housing Finance Agency home price trends, and industry research on real estate supply cycles.
Each of these factors influences investment performance differently, which is why the ranking should be viewed as a framework rather than a formula. The sections after the list explain how each metric affects cash flow, risk, and long-term returns, and why some factors carry more weight than others depending on the investment strategy.
A list of data sources used in this ranking is provided in the notes at the end of the article.
1. South Carolina
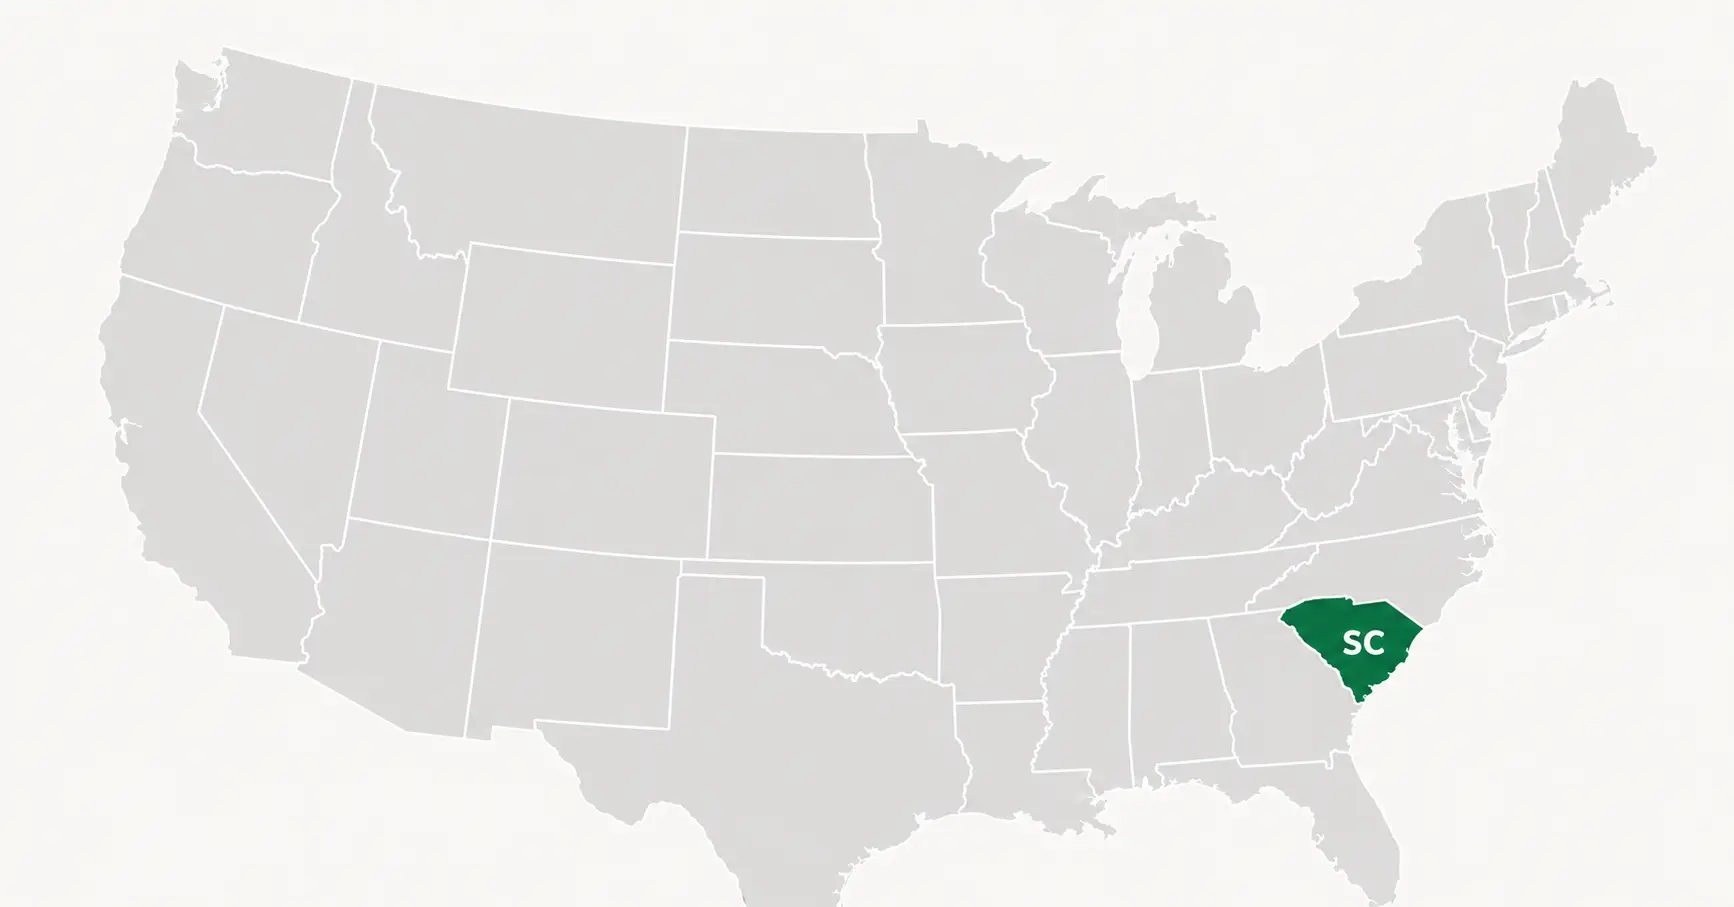
South Carolina carries the cleanest overall balance in this group. It combines the fastest population growth among the five states at 1.5% annually, a strong gross yield proxy, the lowest property tax rate, manageable insurance, and the strongest cycle overlay. Charleston is classified expansion phase, while Greenville and Columbia are in recovery. All three major metros post positive rental growth since 2024.
What works: South Carolina's low property taxes, above-average gross yields, and strong population-driven demand create favorable conditions for rental property investors across multiple submarkets. Charleston's expansion-phase cycle position and Greenville's recovery trajectory provide entry opportunities at different price points.
The state maintains a landlord-friendly legal environment, with no statewide rent control and relatively efficient eviction procedures that reduce lost-rent exposure compared with many coastal markets.
Current risk: The statewide rental vacancy rate of 9.8% is the highest in this group. Charleston has 6.66% of existing inventory under construction (4,036 units). Submarket-level vacancy trends matter more here than statewide population growth figures.
Best-positioned markets: Greenville and Columbia. Charleston remains attractive, but investors should underwrite conservatively given the volume of new supply entering the market.
2. North Carolina

North Carolina carries a strong employment base, a growing research and technology economy anchored by the Research Triangle, and a landlord-friendly legal environment. Five major metros post positive rental growth trends, and the statewide population grew 1.3% from 2024 to 2025. Property taxes sit at 0.6%, and insurance costs are moderate relative to other Southeast states.
What works: A growing professional-class tenant base, moderate gross yields, low property taxes, and manageable insurance costs support long-term rental investment in many secondary and mid-sized markets. Winston-Salem posted rental growth of 6.6% from 2024 through 2026 YTD, while Greensboro grew 4.6% over the same period. Both currently offer more favorable entry conditions than the state's largest metros.
North Carolina offers a generally landlord-friendly legal framework, with no statewide rent control and a streamlined eviction process that typically moves through the courts without significant delay.
Current risk: Charlotte and Raleigh-Durham are in hypersupply and recession-cycle phases, respectively. Raleigh-Durham has 12.85% of existing inventory under construction (23,496 units), while Charlotte has 9.49% (20,677 units). Home appreciation remains near flat statewide, limiting equity growth potential for investors buying at current prices. North Carolina should not be viewed as a uniformly strong market.
Best-positioned markets: Greensboro, Winston-Salem, and selected Durham submarkets. Charlotte and Raleigh warrant a more cautious approach given the volume of new supply in the pipeline.
3. Georgia
Georgia offers the highest gross yield proxy in this group at 7.0%, driven by strong rental demand in Atlanta and secondary markets. The state's unemployment rate of 3.5% is the lowest here, major-metro rental growth has been positive through May 2026, and insurance costs are the most manageable among the Southeast states at $2,323 annually.
What works: Georgia's diverse employment base, including corporate headquarters, logistics, healthcare, and the film industry, supports a stable tenant pool across much of the state. Augusta posted rental growth of 5.4% from 2024 through 2026 YTD and remains largely insulated from the supply pressures affecting Atlanta. At 7.0%, Georgia also offers one of the strongest gross yield profiles in this group.
Additionally, Georgia maintains one of the more landlord-friendly legal environments in the country, with no statewide rent control and a relatively fast eviction process that supports property owners.
Current risk: Atlanta is in a hypersupply phase, with 3.88% of existing inventory under construction (19,235 units). Home values have declined 1.0% on a ZHVI basis over the past year. Investors targeting the Atlanta metro should focus on submarket-level conditions rather than broad market averages. The state's strongest yield opportunities are currently found in secondary markets where new supply has remained more balanced.
Best-positioned markets: Augusta, Savannah, and Columbus. Atlanta remains investable, but market selection and underwriting discipline are particularly important given current supply conditions.
4. Indiana

Indiana is the most affordable large-population state in this group, with a typical home value of $259,711 and the lowest unemployment rate at 3.2%. Home prices grew 3.0% on a ZHVI basis over the past year, and the FHFA repeat-sales index shows 3.6% appreciation — the strongest price momentum among these five states. Indianapolis rental metric grew 5.6% from 2024 to 2026 YTD.
What works: Indiana's affordability supports stronger cash flow by keeping acquisition costs and debt service relatively low compared to rental income. Positive rent growth, solid home appreciation, and low unemployment support both cash-flow and long-term hold strategies. The state also maintains a landlord-friendly legal environment, with no statewide rent control and relatively efficient eviction procedures.
Current risk: The statewide rental vacancy rate of 8.9% is elevated. Indianapolis is in a hypersupply phase, with 5.32% of existing inventory under construction (7,628 units). Investors focused exclusively on Indianapolis face a greater risk of rising vacancy and slower rent growth than investors targeting other parts of the state.
Best-positioned markets: Fort Wayne, Bloomington, Lafayette, and South Bend. Indianapolis remains investable, but vacancy assumptions should be underwritten conservatively given current supply conditions.
5. Kentucky

Kentucky carries the lowest typical home value among the top-ranked states at $235,060, which supports favorable rent-to-price economics. The FHFA repeat-sales index shows 4.7% home appreciation over the past year, the strongest price momentum among all states evaluated in this analysis. All major metros tracked in this study also posted positive rental growth, indicating that both rents and home values continue to move in the same direction.
What works: Low entry prices and strong home appreciation make Kentucky attractive for investors seeking a combination of cash flow and equity growth. Rent levels remain well supported relative to home values, creating favorable economics for long-term rental properties without relying on aggressive rent assumptions.
Kentucky provides a favorable legal environment for rental property owners, with no statewide rent control and a straightforward eviction process for nonpayment cases.
Current risk: Insurance costs, at $4,042 annually, are the highest in this group and can reduce cash flow more than headline yield figures suggest. Louisville is in a hypersupply phase, with 6.37% of existing inventory under construction (4,084 units). The ZHVI one-year trend is slightly negative at -0.7%, diverging from the stronger FHFA appreciation signal and warranting continued monitoring.
Best-positioned markets: Lexington, Bowling Green, and selected Louisville submarkets outside the highest-supply corridors.
States with Strong Name Recognition but Elevated Risk in 2026
These three states appear on nearly every "best states" list published in the last two years. They attract investor capital and rank high in name recognition. They also carry risk profiles that most investor guides do not adequately disclose.
Texas: High Taxes, Negative Rent Trend, Elevated Vacancy
Texas has 1.2% annual population growth, no state income tax, and a landlord-friendly legal environment. Those facts are accurate and widely cited. Texas also carries an 11.0% rental vacancy rate, the highest in the ten-state analysis. Home values have declined 1.9% on a ZHVI basis over the past year, and the FHFA repeat-sales index is down 1.6%. Major-metro rental growth across Dallas, Houston, Austin, and San Antonio is negative, running -0.3% from the 2024 average through May 2026 YTD and -0.4% on a May 2026 year-over-year basis. Property taxes at 1.4% effective rate and insurance averaging $4,085 annually create a high fixed-cost baseline before debt service.
The IRR Viewpoint 2026 cycle classification reinforces the picture: Dallas is in hypersupply, Houston and San Antonio are in recession phase, and Austin is in recovery. Austin carries 9.33% of its existing inventory under construction (29,625 units). Houston carries 2.88% of existing inventory but sits in the recession phase because absorption is not keeping pace with completions.
Texas works for investors with local market knowledge, existing relationships, and specific submarket theses. Population growth alone does not offset flat rents, rising vacancy, and $4,000-plus in annual insurance costs on a sub-$310,000 home.
Florida: Insurance Costs Compress Every Margin
Florida's gross rental yield proxy of 7.6% is the highest in the ten-state analysis, driven by high rents relative to home values. The gross yield figure does not account for insurance. Florida homeowners insurance averaged $7,136 annually in 2026 per Insurance.com data — more than $4,000 higher per year than in South Carolina and more than $5,000 higher than in Indiana. That cost alone can move a property from cash-flow positive to breakeven, before accounting for the remaining expense line items.
Florida's rental vacancy rate of 10.2% is the second-highest in the dataset. Home values have declined 3.3% on a ZHVI basis, the steepest drop among all ten states. The FHFA repeat-sales index is down 0.5%. Major-metro rental growth across nine Florida metros sits essentially flat at +0.2% from the 2024 average to 2026 YTD, and -0.1% on a May 2026 year-over-year basis. Cape Coral rental growth (ZORI metric) is down 5.4% from 2024 to 2026 YTD. North Port is down 2.9%.
IRR Viewpoint 2026 classifies Miami, Orlando, Broward-Palm Beach, Naples, and Sarasota as hypersupply. Tampa and Jacksonville carry a recovery signal, which is marginally better, but Florida's fixed-cost structure remains the primary underwriting obstacle regardless of cycle position.
Florida properties can work for investors who own them at low or no leverage. For DSCR-financed properties at typical loan-to-value ratios, the insurance-to-rent relationship currently limits the number of deals that hit 1.0 DSCR without aggressive assumptions.
Tennessee: Flat Rents, Concentrated Supply Risk
Tennessee's investor appeal rests on three facts: no state income tax, landlord-friendly laws, and Nashville's decade-long growth narrative. All three remain true. Nashville's rental growth is up only 0.3% from the 2024 average to 2026 YTD, and its May 2026 year-over-year reading is +0.1%. Nashville carries 8.06% of its existing inventory under construction (14,144 units), which IRR classifies as hypersupply. Memphis is in recession phase.
Statewide, major-metro ZORI averages +1.9% from 2024 to 2026 YTD and +0.4% year-over-year in May 2026 — positive, but weaker than all five core states. Knoxville and Chattanooga carry better supply conditions than Nashville and offer cleaner entry points for investors who want Tennessee exposure without concentrated supply risk.
Tennessee is a state where the markets with the strongest reputations face the most supply pressure. Investors working from Nashville's growth story without current vacancy and rental growth data are working from an outdated picture.
States to Avoid for Rental Property Investors
High-tax, high-regulation states. California and New Jersey combine high effective property tax rates, active rent control in major markets, extended eviction timelines of 90 days or longer, and purchase prices that produce gross yields below 4% in most markets. Cash flow is structurally difficult without significant equity or non-standard financing. These states can support appreciation-focused or commercial strategies, but they do not support standard long-term residential rental investment for most investors.
States with declining demand fundamentals. States with weakening demand fundamentals require additional caution. West Virginia, Mississippi, and Louisiana share several overlapping challenges, including slow population growth, elevated vacancy rates, and weaker income growth than many competing markets. West Virginia carries a 9.3% rental vacancy rate alongside the lowest average monthly rent ($732) in the country. Louisiana's vacancy rate reached 10.1% in 2025, while home values declined year over year.
Insurance costs are also among the highest in the nation, particularly in coastal markets where windstorm and flood coverage can materially reduce cash flow. Low purchase prices alone do not create a strong investment opportunity when rents are under pressure, operating expenses are elevated, and tenant demand remains weak.
What Separates a Good State Pick from a Costly Mistake
There are many metrics used in real estate investment analysis, but 8 factors typically determine whether a state has strong potential for a long-term rental strategy. Six are measurable indicators that can be compared across states using percentages, ratios, or dollar amounts.
The remaining two, the real estate cycle and landlord-friendliness, are market-structure factors that cannot be distilled into a single number but often influence investment outcomes just as much as the quantitative metrics.
The weight assigned to each metric is subjective, and no single index or criterion can produce a definitive ranking. Many factors depend on the investor's strategy, including whether the primary objective is appreciation or cash flow.
Therefore, state-level analysis should be viewed as a starting point. Investors should also examine data at the metro and city level before making an investment decision. Let's look at the primary metrics in more detail and understand how each one influences the investment decision.
Rent-to-Price Ratio and Cash Flow Baseline
The gross rental yield proxy divides annualized rent by home value. It measures how much income a rental property generates relative to its purchase price before accounting for any operating expenses. A gross yield of 6% or above provides enough headroom to carry expenses, debt service, and vacancy without falling into negative cash flow territory.
Rent Growth Trend
Gross yield measures a property's income at acquisition. Rent growth determines whether that income expands or erodes over time. Rising rents help offset inflation and increasing operating expenses, while stagnant or declining rents put pressure on cash flow and reduce long-term returns.
For that reason, rent growth is one of the most important indicators of a rental market's future performance. States with persistently weak rent growth deserve closer examination, regardless of how attractive current yields may appear.
Vacancy Rate and Supply Conditions
Vacancy measures how much of the rental supply sits unoccupied at any given time. A state vacancy rate below 7% signals balanced supply and demand. Above 9%, supply is outrunning absorption, meaning new units are entering the market faster than tenants are leasing them. The critical risk is that high vacancy can coexist with high gross yields in some markets. The yield looks attractive because home prices have fallen, but rents are also softening as more units compete for the same tenant pool.
Population and Job Growth
Population growth drives long-term rental demand by expanding the tenant pool. Job growth supports tenant quality by keeping incomes stable and unemployment low. Both metrics matter, but neither signals a good investment in isolation. A state can add residents rapidly while also adding rental units at an even faster rate, which produces the oversupply conditions that pressure rent.
Home Appreciation
Home appreciation measures how property values change over time. Rising values generally indicate that demand is keeping pace with or exceeding supply, while declining values suggest the opposite. For appreciation-focused investors, price growth is a primary source of return. For cash-flow investors, it serves as an additional signal of market strength and long-term stability.
A market with rising rents and increasing property values presents a different risk profile than one where both rents and prices are under pressure. Appreciation also affects the amount of equity an investor can build over time, influencing future refinancing options and overall portfolio growth.
Property Taxes and Insurance Costs
Property taxes and insurance are recurring operating expenses that directly reduce rental property cash flow. Unlike many other costs, they are largely determined by the property's location and remain outside the investor's control. As a result, two properties with similar purchase prices and rental income can produce very different returns once local taxes and insurance costs are factored in.
Investors often underestimate these expenses during the acquisition phase, particularly in markets where property taxes are high or additional coverage, such as flood, windstorm, or wildfire insurance, may be required. Because these costs continue regardless of occupancy or market conditions, they play an important role in long-term profitability and should be evaluated alongside rents, vacancy, and appreciation trends.
Landlord Laws and Eviction Timelines
State law governs how quickly a landlord can remove a non-paying tenant, whether rent increases can be capped, and how much control landlords have over security deposit terms and lease enforcement. In landlord-friendly states, nonpayment evictions often conclude within 30 to 45 days.
In tenant-friendly states, the same process can take 90 days or longer, with mandatory mediation, extended notice periods, and additional procedural requirements adding delay. In some cases, disputes are more likely to escalate into litigation, increasing legal costs and extending the period during which a property generates little or no income.
Where the Market Cycle Sits Right Now
The real estate cycle reflects the balance between supply and demand in a market. Markets move through periods of expansion, stabilization, oversupply, and recovery, and each phase creates different opportunities and risks for rental property investors.
A market can score well on population growth, employment, rent growth, and other key metrics while still being in the wrong phase of the cycle. If new supply enters faster than demand can absorb it, vacancy rises, rent growth slows, and home prices come under pressure even as the market continues to add residents and jobs.
By contrast, markets emerging from a downturn or recovery phase often offer a more favorable entry point, with adjusted pricing and stronger potential for future rent and value growth. Timing matters just as much as the underlying metrics.
_result.webp)
Best Places To Buy Rental Property: Financing Options in 2026
Below are the primary rental property loan options available to investors in 2026, and when each one applies.
DSCR Loans (Income-Based Financing)
- What it is: Qualification based on the property's rental income rather than the borrower's personal income or debt-to-income ratio.
- When to use it: The preferred option for rental property investors and portfolio builders. Personal income does not limit deal volume — each property qualifies on its own rent.
- Ridge Street insight: Our DSCR calculator allows investors to stress-test occupancy, rates, and loan terms to confirm a deal pencils under conservative assumptions.
Short-Term Rental Loans
- What it is: DSCR loan for Airbnb programs that underwrite on projected or historical short-term rental revenue (Airbnb, VRBO) rather than long-term lease rates.
- When to use it: When the property's STR income is materially higher than its long-term rent equivalent, and a standard DSCR program would undervalue the asset's income potential.
- Ridge Street insight: We underwrite Airbnb loans using AirDNA market data with a vacancy discount applied to confirm the deal holds under conservative occupancy assumptions.
DSCR Cash-Out Refinance
- What it is: Extraction of equity from an existing rental property without documenting personal income, using the property's current rent to qualify.
- When to use it: Effective for investors recycling equity into the next acquisition without selling assets or taking on a personal income-based loan.
- Ridge Street insight: Our DSCR Refinance calculator allows investors to run the numbers and check if DSCR Cash-out refinance makes sense before applying for pre-approval.
Conventional Loans
- What it is: Traditional bank financing at the lowest available rates, underwritten against the borrower's personal income and credit profile.
- When to use it: Best suited for investors purchasing a first rental property at low leverage in a highly predictable market, or a second home used part-time as a rental.
- Trade-off: Strict debt-to-income limits and a cap on financed property counts make conventional loans a poor fit for investors scaling beyond two or three properties.
Fix and Flip Loans for Value-Add Rentals
- What it is: Short-term acquisition and renovation financing, commonly referred to as hard money, used to purchase, rehab, and reposition a property before either selling it for a profit (fix-and-flip) or refinancing into long-term rental financing (fix-to-rent).
- When to use it: When a property's condition prevents it from qualifying for conventional or long-term rental financing, or when renovations are needed to increase value, improve rents, and stabilize the asset.
- Ridge Street insight: We structure fix-and-flip loans with financing of up to 90% of total project costs. Investors planning to hold the property can transition directly into DSCR financing after the renovation is complete and the property is rent-ready. Use our Fix and Flip Calculator and Hard Money Loan Calculator to evaluate the numbers before making an offer.
How Ridge Street Capital Finances Rental Property in These Markets
Ridge Street Capital is a private lender specializing in DSCR loans, short-term rental loans, and fix-and-flip loans across 35 states. Every state in this guide is within our lending footprint.
When Ridge Street evaluates a rental property deal, the analysis goes beyond the property numbers. We look at the market the property sits in — vacancy trends, rent trajectory, local supply conditions, and whether the market cycle supports the investor's exit or hold strategy.
Submit a rental property and borrower details through our Quick Application and receive a pre-approval letter within 24 hours.
Frequently Asked Questions
What states have the worst landlord laws?
California, New Jersey, and Oregon present the most restrictive operating environments for residential landlords. California and New York have active rent stabilization in major markets that limits increases, often to below-inflation rates. Eviction timelines in these states run 90 to 180 days in contested cases. Illinois has no statewide rent control, but Chicago's local ordinances create similar friction across the state's primary rental market. For out-of-state investors operating with property managers, these legal environments add cost and timeline risk that rarely compensates for the higher gross rents.
Does the state I invest in affect my DSCR loan terms?
Yes, in two direct ways. First, property taxes and insurance costs reduce net operating income, which lowers the DSCR ratio the lender calculates. A property in Florida carrying $7,000 in annual insurance costs will produce a materially lower DSCR than an identical property in a state where insurance runs $2,500, even at the same purchase price and rent.
Second, DSCR lenders assess vacancy and rent trend conditions at the market level when underwriting. A deal in a market with 10% rental vacancy and softening rents carries different risk than the same gross yield in a market with 6% vacancy and positive rent momentum. Both factors influence whether the loan gets approved, at what LTV, and occasionally at what rate.
Can I use a DSCR loan to invest in a state where I do not live?
Yes. DSCR loans are specifically structured for investment properties and do not require the borrower to occupy the property or live in the same state. Qualification is based on the property's rental income relative to its debt service, not the borrower's personal income or primary residence location.
This makes DSCR the standard financing vehicle for out-of-state investors building portfolios across multiple markets. The borrower's credit profile, the property's condition, and the lender's state-specific licensing determine eligibility — not the geographic distance between the investor and the property.
Can investors finance multiple rental properties across different states with DSCR loans?
Yes, and DSCR structure is specifically suited to portfolio expansion across states. Because each loan is underwritten on its individual property's income rather than the borrower's aggregate personal debt load, adding properties in new states does not automatically trigger the debt-to-income limits that constrain conventional financing. Investors building multi-state portfolios typically maintain a separate LLC per state or a portfolio-level entity structure, and lenders vary in how they treat entity vesting and cross-state exposure. The practical ceiling on DSCR portfolio growth is usually the lender's per-borrower exposure limit or the investor's available equity for down payments.
Sources and Notes
A note on the metrics used in each table:
- Typical home value (ZHVI): Zillow's typical home value estimate for the state, used as the purchase price proxy.
- Home appreciation (1Y): One-year price change from the FHFA repeat-sales index, which tracks price changes on the same single-family properties over time. This is a momentum signal, not a price-level figure.
- Avg. rent proxy: Average monthly rent from Zillow Rental Manager, covering all bedroom counts and property types. This is a broad market proxy, not a property-specific rent estimate.
- Gross yield proxy: Annual rent proxy divided by ZHVI. A simple income-to-price ratio used for cross-state comparison. It does not account for taxes, insurance, vacancy, management, or debt — those factors are addressed in the individual state analysis.
- Major-metro ZORI: Rent trend from Zillow's Observed Rent Index at the metro level, which controls for changes in rental stock quality. Figures shown are unweighted averages across major metros within each state and represent directional momentum.
- Insurance proxy: Average annual homeowners insurance premium from Insurance.com (2026). Actual landlord and dwelling-fire policies will differ; this figure is used for cross-state cost comparison.
Data Sources:
- Zillow Research Housing Data — ZHVI typical home value and ZORI metro CSV.
- Zillow ZORI Methodology — Definition and repeat-rent control explanation.
- Zillow Rental Manager Market Trends — Broad rent proxy (all beds/all property types):
- U.S. Census Bureau Vintage 2025 Population Estimates — State population change 2024–2025.
- U.S. Bureau of Labor Statistics, Local Area Unemployment Statistics — State unemployment, April 2026.
- Federal Housing Finance Agency House Price Index — State HPI 1-year momentum (repeat-sales index).
- U.S. Census Bureau Building Permits Survey — Annual 2025 building permit counts, released May 14, 2026
- U.S. Census Bureau Housing Vacancies and Homeownership — Annual 2025 rental vacancy rates.
- FRED / Census Vacancy Series — State rental vacancy supplemental data.
- Tax Foundation — Effective property tax burden by state.
- Insurance.com — Average homeowners insurance premiums by state, 2026:
- Integra Realty Resources, Viewpoint 2026 — Multifamily cycle classification and under-construction supply pipeline. Used as rental market supply/demand overlay.

Funding For Purchase + Rehab

$50,000 up to $3,000,000
Interest Rate 10.5%-11.5%
Origination Fee From 1.5%
Up to 90% of Purchase and 100% of Rehab


Perfect for first-time investors or experienced investors scaling their rental portfolio.


.png)
.png)
Designed for investors pursuing higher rents with a short term rental strategy.
.svg)