Best Real Estate Markets for Flipping Houses in 2026


June 29, 2026
Investors searching for the best real estate markets for flipping houses in 2026 are navigating a market that looks very different from just a few years ago. National gross flip margins fell to their lowest level since 2008 through most of 2025 before posting their first improvement in nearly two years during Q1 2026.
That recovery does not mean conditions are easy. Gross returns remain well below historical levels, and national averages hide significant differences in profitability between local markets. A strategy that works in one city may produce very different results in another, making local market knowledge one of the most important drivers of a successful flip.
Based on the criteria outlined below, Ridge Street Capital identified ten markets that fall into three categories: prime markets suited to experienced flippers operating at scale, selective markets with strong underlying fundamentals, and popular markets that currently carry more risk than many investors expect.
This framework helps investors identify promising markets before evaluating the best fix-and-flip lenders for their financing strategy and underwriting requirements.
Prime, Liquid Markets for Experienced Flippers
Investors flipping multiple properties each year value consistency as much as profit margin. They need a steady flow of deals, reliable contractors, active buyers, and enough transaction volume to price projects accurately and sell them quickly. The five markets in this group were selected as the best real estate markets for flipping houses because they provide those conditions, supporting consistent execution for investors operating at scale rather than pursuing one or two selective flips.
1. Indianapolis, IN

Indianapolis leads the prime group on days on market: Redfin data shows homes selling in 28 days on average, the fastest resale velocity of any market in this analysis. For investors carrying hard-money financing, every week the property sits on market after listing is additional interest carry, insurance, and taxes. At 28 days, Indianapolis allows investors to underwrite short project timelines with reasonable confidence rather than building in buffer weeks.
What works: The $254,847 median entry price keeps acquisition cost within a range where renovation spend as a percentage of purchase is more manageable than in higher-priced metros. Monthly sales volume of 3,150 gives investors consistent comparable sales data and steady buyer pool throughput. The 1.9% year-over-year price appreciation supports ARV assumptions without requiring speculation. Indiana bans rent control statewide, and a nonpayment eviction requires only a 10-day notice to quit, which matters for flippers using a BRRRR method as an alternative exit.
Current risk: The 35.8% price-drop share signals that sellers are adjusting to buyer expectations more actively than the DOM figure alone suggests. It means 35.8% of listed homes had at least one asking-price reduction. Flippers should not rely on price momentum to carry a deal that is marginal at acquisition. Indianapolis sits in multifamily hypersupply in recent cycle data, which does not directly affect single-family home flip exits but signals broader supply absorption pressure in some submarkets.
Best approach: Cosmetic value-add acquisitions in the $150,000-$200,000 range targeting a $260,000-$300,000 ARV. The 28-day DOM supports a 90-120 day total project timeline at hard-money rates.
2. Charlotte, NC
Charlotte is the only prime-group market to combine positive year-over-year price appreciation with sales volume above 3,000 homes per month. Prices rose 2.3% year-over-year per Redfin, and buyers are paying 98.8 cents on the list dollar — the highest sale-to-list ratio in the prime group. That combination of price growth and buyer willingness to pay near list gives investors more reliable ARV support than markets where prices are declining.
What works: Charlotte's financial services and technology employment base produces a qualified buyer pool that can support renovated properties in the $400,000-$550,000 ARV range. North Carolina's insurance and property tax structure is moderate relative to Florida and Texas, which preserves more net margin on a given gross spread. The Charlotte market has seen an 18.5% decline in flip rate over the past year per available deal data, which means competition for available properties is lower than it was during the peak investor activity years.
Current risk: At $434,740 median entry price, Charlotte is a larger-ticket market. Carry costs scale with the loan balance — a $400,000 acquisition at hard-money rates generates roughly $3,300-$4,000 per month in interest alone.
Best approach: Focus on established neighborhoods where the spread between the distressed purchase price and the after-repair value (ARV) is greatest. Cosmetic and moderate system upgrades completed within 60 to 90 days help keep carrying costs under control.
3. Atlanta, GA
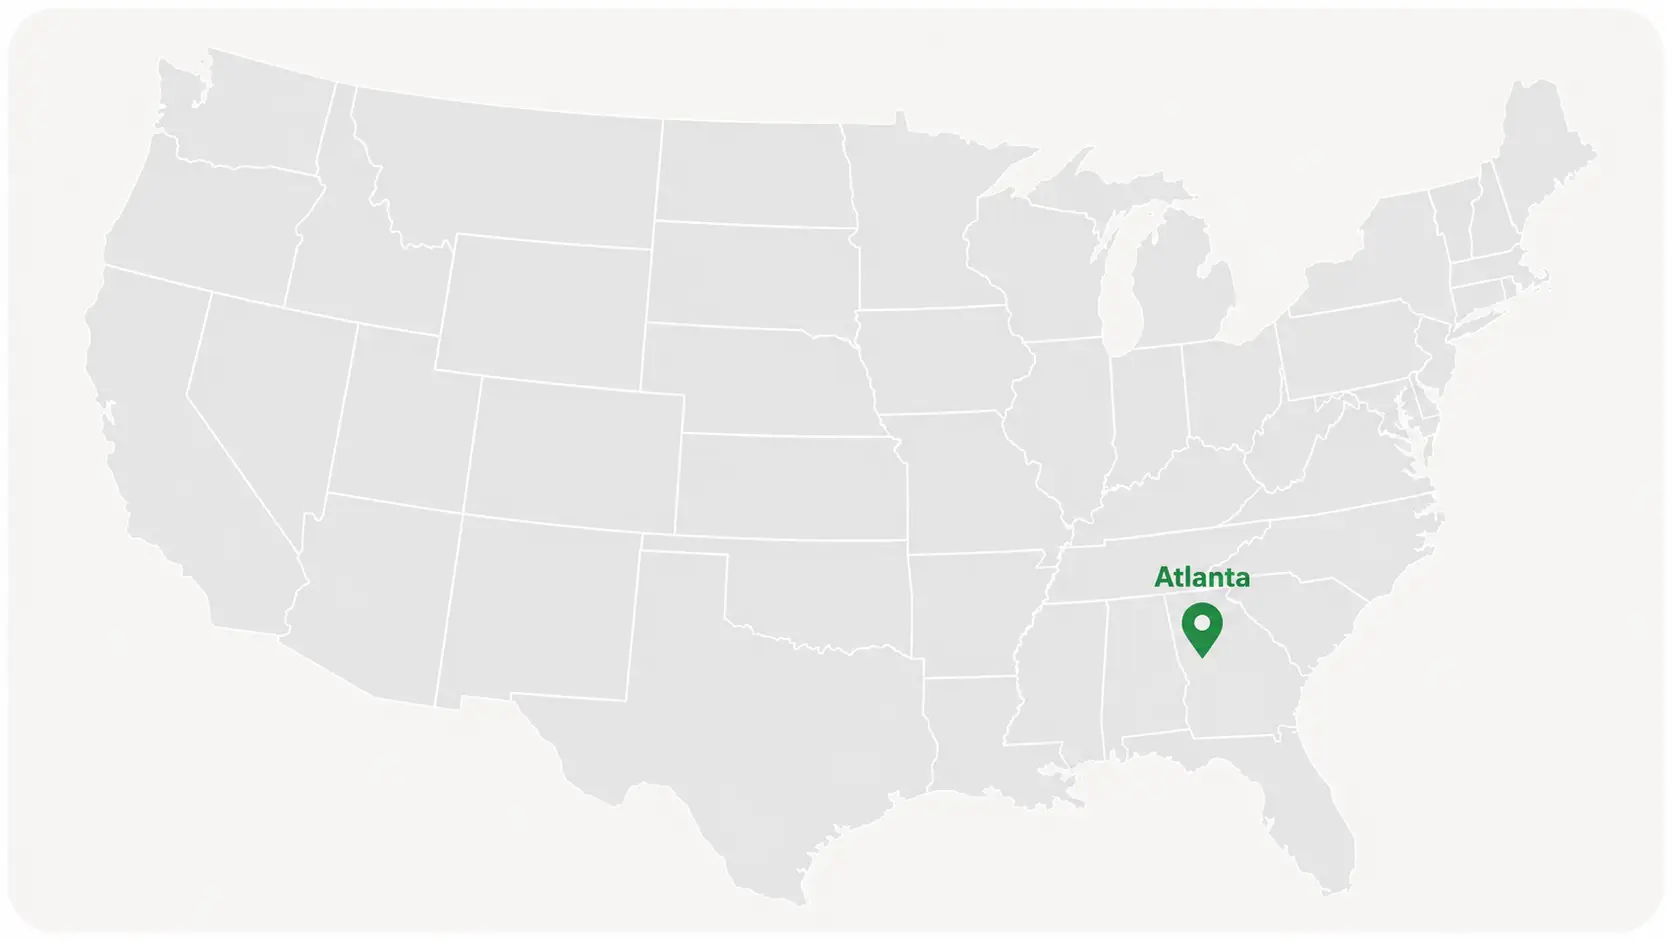
Georgia led the nation in residential flip activity in late 2025, with Atlanta accounting for much of that volume. Flipped homes represented 12.3% of all Q1 2026 sales in the metro, one of the highest shares among major U.S. markets. That level of activity supports a mature renovation ecosystem, including experienced contractors, abundant comparable sales, and an active buyer pool, reducing execution risk for investors entering the market.
What works: Georgia carries materially lower insurance and property tax drag than Florida or Texas for the same asset type. Renovation labor costs in Atlanta run below national averages, which gives flippers more net margin on a given gross spread. Secondary submarkets outside the urban core offer purchase prices below $325,000 with post-renovation ARVs in the $425,000-$525,000 range.
Current risk: Prices are down 1.6% year-over-year, and 35.4% of sellers are cutting asking prices. Flippers targeting the $400,000-$500,000 ARV range compete directly with new construction supply. The flip share figure confirms high activity volume, not margin quality. Atlanta had measurable multifamily supply additions over the 2024-2025 period, which signals ARV discipline is essential in submarkets with new product nearby.
Best approach: Focus on secondary submarkets at sub-$325,000 acquisition. Avoid submarkets where new construction supply directly competes with the post-renovation price point.
4. Orlando, FL
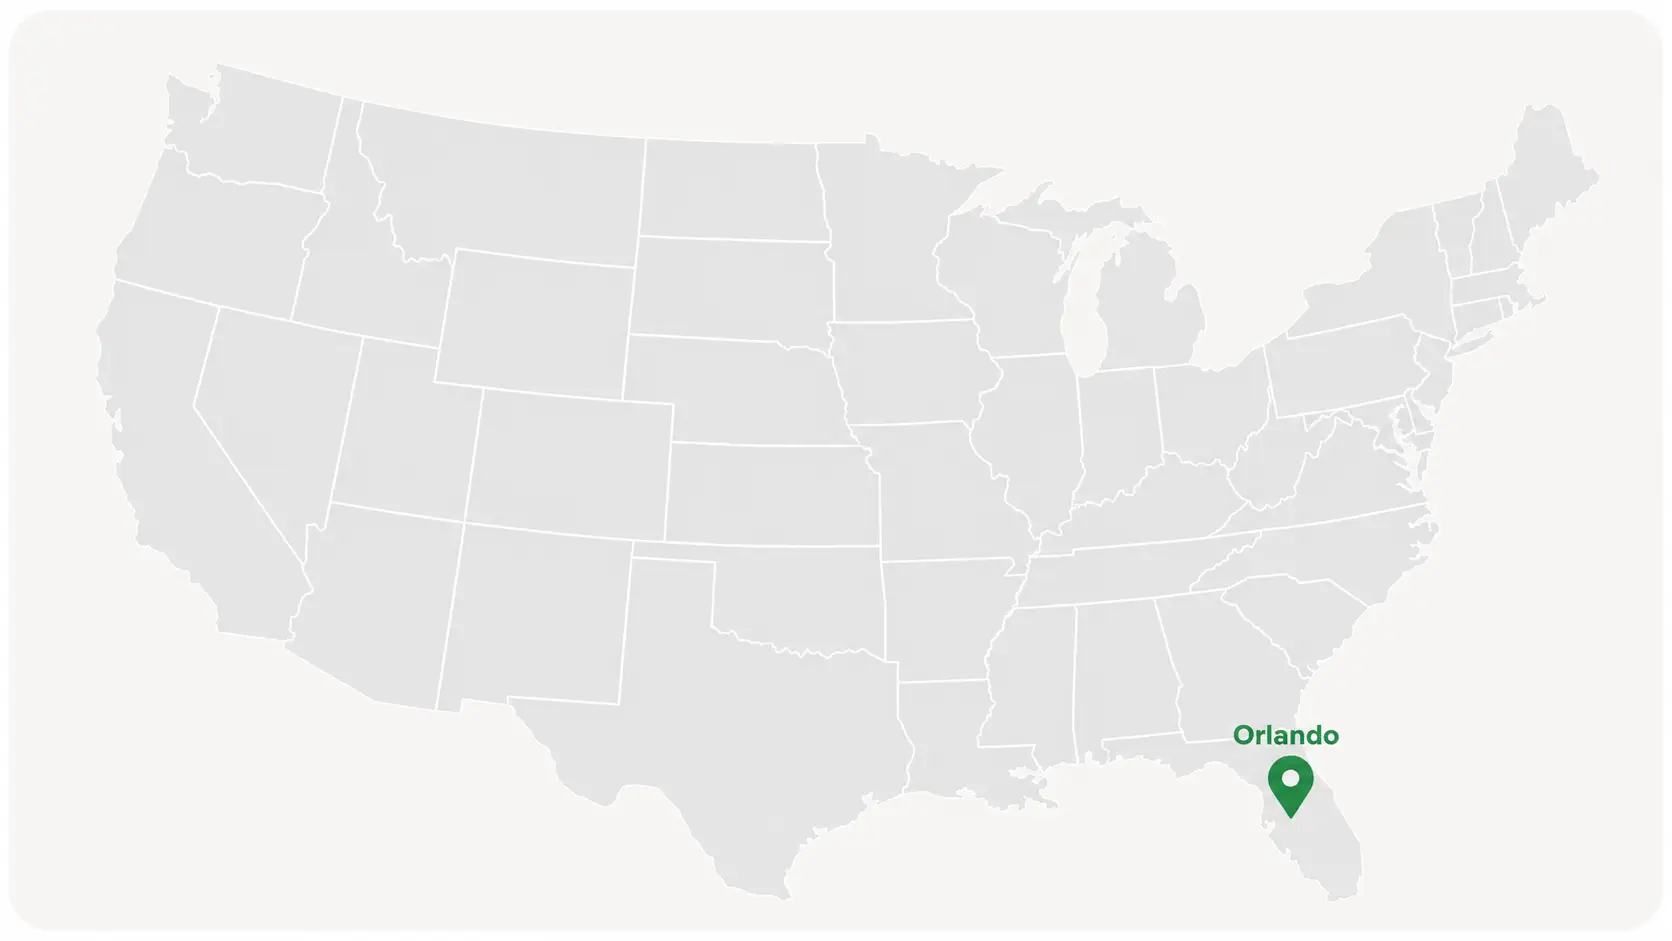
Orlando posted a 22.3% gross flip margin in Q2 2025 — above the national average at the time. The entry price of $409,755 is below Tampa and Miami within Florida, giving investors a more accessible basis for targeting the first-time and move-up buyer segment that drives the central Florida resale market.
What works: Orlando's population growth is sustained by tourism employment, healthcare, and continuous in-migration from higher-cost Florida metros. The buyer pool is strong for properties priced below $450,000, giving flippers access to a wide pool of qualified buyers who cannot afford new construction at current pricing.
Current risk: Florida homeowners insurance averaged $7,136 annually in 2026. That cost compresses achievable ARVs on two fronts: it raises the flipper's carry expense and reduces the effective purchase price that a qualified buyer can support at any given monthly payment. Prices are down 2.0% year-over-year and the sale-to-list ratio of 96.7% means buyers are already negotiating discounts. The margin signal from Q2 2025 has narrowed since, as both price trends and supply have worked against the thesis.
Best approach: Target acquisitions below $350,000 and focus on cosmetic renovations with only essential system repairs. Underwrite the exit at roughly 90-95% of the expected list price, and validate buyer affordability using current investment property mortgage rates with realistic insurance and closing costs.
5. Dallas-Fort Worth, TX
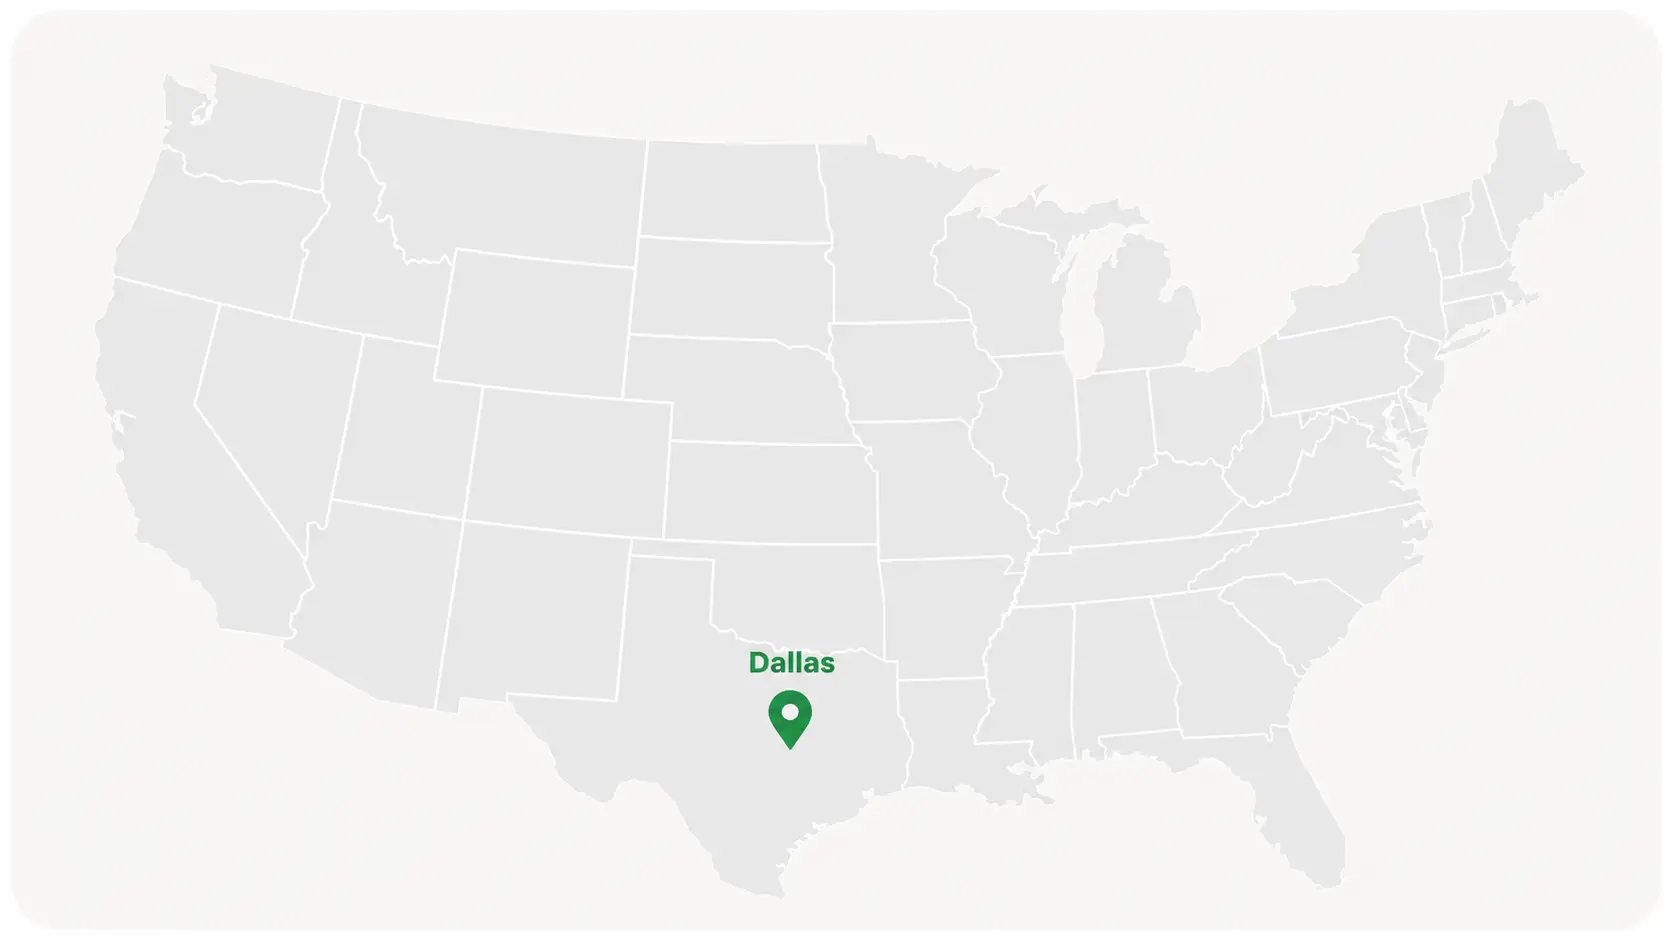
Dallas-Fort Worth generates more real estate transaction volume than any other market in this analysis. The deal flow, contractor ecosystem, and buyer depth that come with that volume are real operational advantages for experienced flippers who source off-market at genuine discounts.
What works: Dallas-Fort Worth is one of the most established fix-and-flip markets in the country, with consistent deal flow, a deep contractor network, and a large resale buyer pool. More than half of sellers are reducing their asking prices, creating opportunities for investors who can negotiate meaningful acquisition discounts. The 40-day average time on market also helps limit carrying costs for well-executed projects.
Current risk: Dallas has one of the lowest published gross flip margins among the major metros in this analysis, reflecting high acquisition prices and slower home price appreciation. Property taxes and insurance further reduce profitability, leaving less room for error. Successful deals typically come from meaningful acquisition discounts, off-market distressed properties, rather than properties purchased near current market value.
Best approach: Focus on opportunities with clear pricing dislocations, such as distressed sellers, estate sales, or other discounted acquisitions. Keep renovations limited to cosmetic and essential system upgrades to shorten the holding period and control carrying costs. Investors relying primarily on listed properties may find it difficult to achieve attractive margins under current market conditions.
Selective Markets with Strong Data Signals
The second group was selected using a different approach. While the first group favors investors who rely on volume and fast execution, these markets reward careful deal selection and disciplined underwriting. Some offer the strongest verified flip margins in this analysis. Others stand out because of favorable market fundamentals, such as improving demand, lower operating costs, or a stronger position in the real estate cycle. For investors willing to source carefully and underwrite conservatively, these best real estate markets for flipping houses offer compelling opportunities that many higher-profile markets currently do not.
6. Buffalo, NY
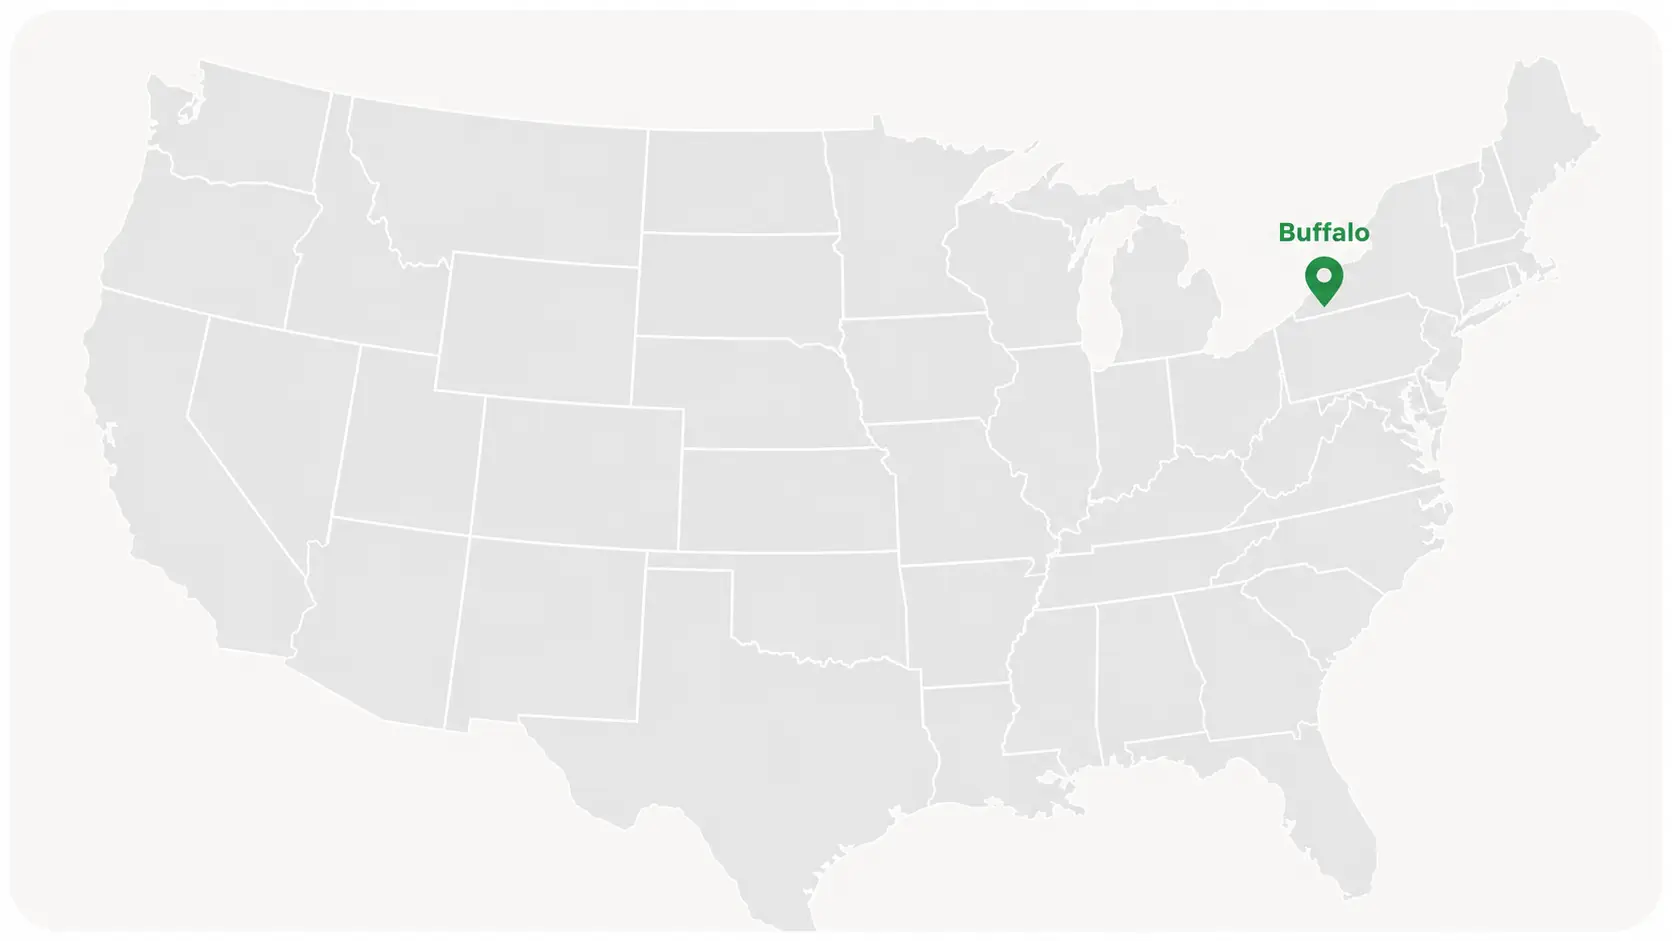
Buffalo posted one of the highest verified gross flip margins in this analysis at 84% in Q1 2026. Lower-priced markets often produce higher percentage returns because the gap between distressed purchase prices and renovated values is wider. For example, a property purchased for $130,000 and sold for $270,000 after renovation generates a gross ROI of more than 100%. Those figures reflect the underlying price level rather than higher absolute profits compared with larger markets.
What works: Buyers are paying at or above asking price — the 100.8% sale-to-list is the highest of any market in this analysis. Price drops are the lowest at 20.7%, which means fewer sellers are negotiating down. Both signals point to a resale environment where renovated properties sell at or near list. New construction costs run materially above existing-home prices in the Northeast, giving renovated properties a structural price advantage over new builds.
Current risk: Monthly sales volume of 395 is the lowest among the markets in this analysis, limiting deal flow, comparable sales, and the ability to scale acquisitions. New York's 1.55% effective property tax is also among the highest in the group. Much of Buffalo's housing stock predates 1960, increasing the likelihood of lead, asbestos, and major system upgrades that can extend renovation timelines and raise project costs.
Best approach: Target acquisitions between $120,000 and $180,000 with cosmetic to moderate renovations and an ARV of $270,000 to $350,000. Build contingency into both the budget and timeline to account for the complexities of older homes. The stronger margin profile provides additional room for conservative underwriting. Use our free fix-and-flip calculator to run numbers for your deal.
7. Pittsburgh, PA
Pittsburgh posted the highest verified gross flip margin in this analysis at 85.9% in Q1 2026. Much of that reflects the economics of a lower-priced market, where the gap between distressed acquisition costs and renovated resale values remains wide. Pittsburgh also has the lowest estimated annual homeowners insurance cost among the markets analyzed, helping reduce carrying costs throughout the project.
What works: The cost of new construction in Pittsburgh remains significantly higher than the price of renovated existing homes, helping preserve demand for well-executed rehabs. The market also offers some of the strongest rental yields in the Northeast, giving investors the flexibility to hold and rent a property if resale conditions weaken.
Current risk: Home prices declined 5.9% year over year, the largest drop among the markets in this analysis. With an average of 63 days on market and 744 monthly sales, resale activity is slower than in the prime markets. Investors should underwrite conservatively using current comparable sales, as resale values may change between acquisition and listing.
Best approach: Focus on established neighborhoods with stable buyer demand and target properties where the spread between acquisition cost and after-repair value remains meaningful. Build a project timeline of approximately 150 days to account for the slower resale environment and underwrite exit pricing conservatively. Consider an alternative exit option with a fix-to-rent opportunity.
8. Columbus, OH
Columbus combines one of the strongest home price trends in this analysis with an active housing market. Home values increased 7.4% year over year, while 2,704 monthly sales and a 40-day average time on market provide the transaction volume and liquidity investors need to execute consistently. Continued employment growth, including Intel's multibillion-dollar semiconductor investment, supports long-term housing demand and adds confidence to the market's outlook.
What works: Ohio has one of the lowest estimated homeowners insurance costs in this analysis, helping reduce carrying costs throughout the project. Strong home price appreciation supports resale values, while 2,704 monthly sales provide enough comparable transactions for more reliable underwriting and pricing.
Current risk: Ohio's effective property tax rate of 1.36% is among the highest in this group, increasing annual holding costs. The recent price trend supports the investment case but should not replace conservative underwriting and current comparable sales. Strong price appreciation also raises acquisition costs, leaving investors with less margin for error if resale values or renovation costs fall short of expectations.
Best approach: Focus on established neighborhoods where demand remains strong and the gap between acquisition cost and after-repair value is meaningful. Underwrite resale values using current comparable sales, treat recent price appreciation as a tailwind rather than a guarantee, and account for higher property taxes when estimating project profitability.
9. Jacksonville, FL
Jacksonville offers one of the most balanced risk-return profiles among Florida's major markets for house flipping. Home prices remain substantially lower than in Tampa or Orlando, while monthly sales volume of 3,549 provides the liquidity and deal flow investors need to operate consistently. ATTOM reported a 27.2% gross flip margin in 2025, suggesting that Jacksonville continues to offer workable opportunities despite the margin compression affecting much of Florida.
What works: Compared with other major Florida metros, Jacksonville's lower home prices reduce the capital required to enter a deal and limit absolute dollar exposure if resale values fall short of expectations. A diversified economy, supported by the Port of Jacksonville, logistics, healthcare, and financial services, provides a broader demand base than markets that rely more heavily on tourism. Strong transaction volume also supports more reliable pricing and resale.
Current risk: Florida's high insurance costs remain a major challenge and continue to pressure project profitability and buyer affordability. Gross flip margins have narrowed in recent years, while a 60-day average time on market increases carrying costs before resale. Higher insurance premiums affect both investors during the hold period and buyers at resale, limiting the price many borrowers can qualify to pay.
Best approach: Target acquisitions below $260,000 with an after-repair value between $380,000 and $420,000. Keep renovation timelines within 90 days to reduce carrying costs, and underwrite resale values using current mortgage rates and realistic insurance costs to reflect buyer affordability.
10. Greenville, SC
Greenville combines improving housing demand with one of the lowest operating cost structures in this analysis. Greenville County posted the strongest year-over-year sales growth among the markets evaluated, while South Carolina's low property taxes and moderate insurance costs help preserve margins throughout the project. County-level data is used because it provides a more reliable market sample than the smaller city of Greenville alone.
What works: A diversified employment base, led by manufacturing, technology, healthcare, and advanced industries, supports steady housing demand. South Carolina has the lowest effective property tax rate in this analysis, helping reduce carrying costs, while the market's recovery-cycle position indicates supply and demand are becoming more balanced after recent expansion.
Current risk: With an average of 57 days on market and about 860 monthly sales, Greenville operates at a slower pace than the larger metros in this analysis, making careful acquisition and conservative underwriting more important. The median home price of $368,146 is among the highest in this group, increasing the capital required to enter a deal and leaving less room for error if renovation costs or resale values fall short of expectations.
Best approach: Focus on established neighborhoods where the spread between acquisition cost and after-repair value remains meaningful. Greenville's lower operating costs support project profitability, but success depends on disciplined deal selection, conservative resale assumptions, and controlling renovation timelines.
Markets That Require Tighter Underwriting Before Committing
The third group includes markets that investors inevitably ask about because they appear on almost every list of the best real estate markets for flipping houses. They have earned that reputation through strong population growth, active housing markets, or broad investor interest. However, current data paints a more balanced picture. Resale conditions, supply levels, and, where available, verified profit margins suggest these markets deserve a more cautious evaluation than their reputation alone would indicate.
Raleigh, NC
Raleigh remains one of the most liquid housing markets in this group, with an average 34-day time on market. However, the market's 10.3% gross flip margin and 2.4% year-over-year decline in home prices show that resale speed no longer guarantees strong profitability. Buyers have become more price-sensitive, making conservative ARV assumptions more important than during the previous growth cycle.
Austin, TX
Austin illustrates how quickly market conditions can change after a period of rapid appreciation. Home prices are down 2.3% year over year, while Texas property taxes (1.4%) and estimated annual insurance costs ($4,085) continue to pressure project economics. Even well-executed renovations leave little room for error when acquisition costs remain elevated and fixed expenses consume a larger share of the spread.
San Antonio, TX
San Antonio combines several caution signals. The market has the longest average time on market in this analysis at 73 days, home prices are down 2.6% year over year, and 58.7% of sellers have reduced their asking prices. Longer holding periods increase financing and carrying costs, making disciplined acquisition pricing and conservative resale assumptions essential. Use our hard money loan calculator to estimate financing costs for your deal.
Tampa, FL
Tampa continues to benefit from long-term population growth, but current market conditions require more disciplined underwriting than in previous years. The 96.7% sale-to-list ratio shows buyers are negotiating below the asking price, while home values have declined 1.4% year over year. Florida's estimated $7,136 annual homeowners insurance cost further reduces buyer affordability and can limit achievable resale values.
Nashville, TN
Nashville continues to benefit from strong long-term demand fundamentals, but the current challenge is timing rather than market quality. The market's 70-day average time on market, the second longest in this analysis, extends carrying costs and reduces returns on leveraged projects. Investors should build realistic resale timelines into their underwriting rather than assuming the faster exits seen during the previous market cycle.
What Makes a Market Good for Flipping Houses in 2026
Six criteria determine whether a market produces viable fix-and-flip economics under current financing conditions. A market that performs well on one and poorly on two others rarely produces consistent returns for leveraged investors.
Acquisition Price vs. ARV Spread
The spread between a distressed property's purchase price and its after-repair value sets the gross profit ceiling before any expense is applied. Properties in the $100,000-$200,000 acquisition range have historically produced the highest average gross ROI nationally because renovation costs as a percentage of purchase price are more favorable and the buyer pool at that price remains broad and accessible.
Days on Market and Resale Velocity
Every additional week a flipped property sits on the market after listing adds carrying costs. A $300,000 loan at 10% annualized interest costs approximately $575 per week in interest alone. A market with a 30-day average DOM versus a 70-day market represents 40 additional days, roughly $3,300 in interest on that loan balance, before property taxes, insurance, and utilities.
Inventory Tightness vs. Pre-Pandemic Baseline
Markets where active inventory remains well below 2019 pre-pandemic levels tend to support resale pricing because buyers compete for available supply. Where supply remains constrained, list-to-close price stability is more reliable, and buyers are less likely to negotiate heavy discounts.
Construction Cost Premium Over New Builds
When new construction costs materially more per square foot than a renovated existing home in the same neighborhood, buyers cannot treat new builds as a price-equivalent substitute for a renovated flip. This creates a protective ceiling on what flippers can charge, set by new-build pricing rather than by competing renovated inventory.
Price Momentum and ARV Stability
Declining home prices erode ARV assumptions established at acquisition. A flipper who underwrites a $400,000 ARV in a market where prices subsequently fall 3% must either cut the list price or extend DOM — both reduce net return. Markets with positive price momentum give ARV assumptions directional support through the hold period. Markets with negative trends require larger ARV buffers built into the acquisition price.
Insurance and Property Tax as Fixed Costs
Property taxes and insurance are fixed costs that accrue throughout the holding period regardless of how the renovation progresses. Unlike renovation costs, which investors can control through project scope, these expenses are largely determined by the property's location and value. Higher taxes and insurance increase monthly carrying costs before financing expenses are even considered, reducing the margin available between acquisition and resale.
Fix-and-flip investors should also account for a second insurance expense during construction: builder's risk insurance, also known as course of construction insurance. Unlike standard homeowners or hazard insurance, builder's risk covers the structure, materials, and certain construction-related risks while the property is being renovated.
Most hard money lenders require this policy before releasing renovation funds. Builder's risk premiums are typically based on the renovation budget and project scope rather than the state's insurance market, so they vary far less by location than standard hazard insurance. Both policies should be included in the project budget, but it is the ongoing hazard insurance that creates the largest differences in carrying costs from one market to another.
How Ridge Street Capital Finances Fix-and-Flip Deals
Ridge Street Capital is a direct private lender financing house flipping projects in 35 states. The fix-and-flip loan program provides up to 90% of the purchase price and up to 100% of renovation costs, subject to a maximum 75% loan-to-after-repair value (LTARV).
Every project is underwritten with the investor's exit strategy in mind. Properties intended for resale are evaluated against projected sale proceeds, while BRRRR and buy-and-hold projects are structured for a refinance hard money loan into a DSCR loan once the property is renovated and leased.
To get started, submit basic property and deal information through Ridge Street's Quick Application.
Frequently Asked Questions
What is the 70% rule in fix and flip, and does it still work in 2026?
The 70% rule states that a flipper should pay no more than 70% of a property's after-repair value, minus estimated renovation costs. It serves as a quick acquisition screen. In 2026's compressed-margin environment, many experienced investors are using a tighter threshold — closer to 65% of ARV minus rehab in markets with thin gross margins, and accepting up to 75-80% in fast-moving markets where short hold periods reduce carrying cost exposure. The rule is a starting point for deal evaluation, not a guarantee of profitability. Read more in our comprehensive Fix-and-Flip loans guide for real estate investors.
How does the foreclosure pipeline affect fix-and-flip deal sourcing in 2026?
Foreclosure filings rose 26% year-over-year in Q1 2026, with bank repossessions up 45%. Rising distressed inventory creates more motivated sellers, which is the supply condition that makes deep acquisition discounts possible. The catch is that rising foreclosure activity is typically followed by increased investor competition for that same inventory. Flippers who reach motivated sellers through off-market channels before properties hit the open market benefit most from rising foreclosure supply.
Should I flip in my home market or expand to a new state?
Home-market flipping has operational advantages: contractor relationships, local market knowledge, and faster deal evaluation. Out-of-state flipping removes geography as a constraint on market selection, which matters when the home market has compressed margins or slow resale velocity. The practical challenge of out-of-state flipping is contractor oversight and project management. Investors usually need either a trusted local partner or a market with enough professional investor activity to support a reliable contractor ecosystem.
What renovation scope produces the best flip economics in 2026?
The type of renovation matters just as much as choosing the right rehab loans. Cosmetic and systems-level renovations consistently outperform full gut rehabs on ROI in current market conditions. A cosmetic renovation, including paint, flooring, fixtures, landscaping, and kitchen or bathroom refreshes without layout changes, typically costs 8% to 15% of the after-repair value and can be completed in 45 to 75 days. A full gut renovation produces a higher ARV ceiling but usually takes four to six months and often costs 25% to 40% of ARV in labor and materials. In a market where gross margins are compressed and carrying costs are elevated, the shorter timeline of a cosmetic renovation often produces a better net return than pursuing a higher ARV through a longer, more expensive project.
What markets are best for beginner house flippers?
The best markets for beginner house flippers are usually not the markets with the highest headline ROI or the most expensive resale prices. Beginners should look for metros where the purchase price is manageable, recent sales activity is steady, comparable sales are easy to verify, and homes are not sitting too long after renovation. Markets such as Indianapolis, Columbus, and Jacksonville can be easier to evaluate than higher-priced or more volatile metros because they offer a more practical balance of entry price, resale activity, and underwriting clarity. For investors comparing fix and flip loans for beginners, the safer approach is to choose a market where the deal still works with conservative ARV, realistic rehab costs, and enough room for financing and holding costs.
Sources and citations:
- ATTOM Q1 2026 U.S. Home Flipping Report.
- ATTOM Q2 2025 U.S. Home Flipping Report
- ATTOM 2025 Year-End U.S. Home Flipping Report
- Redfin Market Pages
- Redfin April 2026 Price Drops Report
- Insurance.com 2026 Average Homeowners Insurance by State
- Tax Foundation — Effective property tax by state and county

Funding For Purchase + Rehab

$50,000 up to $3,000,000
Interest Rate 10.5%-11.5%
Origination Fee From 1.5%
Up to 90% of Purchase and 100% of Rehab


Perfect for first-time investors or experienced investors scaling their rental portfolio.


.png)
.png)
Designed for investors pursuing higher rents with a short term rental strategy.
.svg)